作者:MeshCloud脉时云公有云架构师陈博文
一、准备
1、背景
一些客户习惯使用 Prometheus 的度量指标和语法,以便在GCP计算引擎上收集和展示各种指标数据。他们特别选择这种方式,一是习惯于之前的监控方案,二是因为它也能与GCP紧密结合,部署简单、易于更快的投入到GCP的使用当中来。从而使他们能够充分利用GCP的优势。通过 Prometheus+Grafana,他们可以快速、轻松地提取关键指标、生成图表和可视化仪表板,为他们的GCP计算引擎应用程序和系统提供深入洞察和实时反馈。这种与GCP的无缝集成,为客户提供了强大的监测和优化工具,以更好地管理和提升他们在谷歌云上的计算资源。
gce_sd_config 是 Prometheus 中用于自动发现和监控 Google Compute Engine (GCE) 实例的配置方式。它具有以下优点:自动发现实例、动态标签关联、灵活的过滤和配置,以及动态监控环境。通过与 GCE API 集成,Prometheus 可以轻松管理和监控 GCE 实例,提供实时监控数据和自适应的监控环境。
2、下载node_exporter
- 根据机型选择。arm的机器安装x86会报错
| x86 | https://github.com/prometheus/node_exporter/releases/download/v1.6.0/node_exporter-1.6.0.linux-amd64.tar.gz |
| arm | https://github.com/prometheus/node_exporter/releases/download/v1.6.0/node_exporter-1.6.0.linux-arm64.tar.gz |
二、创建带有node_exporter的镜像
- 目的:通过自定义image创建的新实例,就不用再手动去部署node_exporter了
- 机器类型等,按自己的需求修改,这里使用默认的机型
1、创建一台新机器
#案例使用centos centos-7-v20230615 cbw_test可更换为自己的机器名字
gcloud compute instances create cbw-test
    --zone=asia-southeast1-b
    --source-machine-image=centos-7-v20230615
2、部署node_exporter
- 登录机器部署
#下载 node_export
wget https://github.com/prometheus/node_exporter/releases/download/v1.6.0/node_exporter-1.6.0.linux-amd64.tar.gz
#解压
tar -xf node_exporter-1.6.0.linux-amd64.tar.gz
#放到opt,可以按自己情况放,注意修改后面配置的路径
mv node_exporter-1.6.0.linux-amd64 /opt/node_exporter
#配置systemd 根据自己的情况修改端口 这里用9000
cat << EOF > /etc/systemd/system/node_exporter.service
[Unit]
Description=node_exporter

[Service]
Type=simple
ExecStart=/opt/node_exporter/node_exporter --web.listen-address=0.0.0.0:9000
ExecReload=/bin/kill -HUP
Restart=on-failure

[Install]
WantedBy=multi-user.target
EOF

#启动服务
systemctl daemon-reload
systemctl start node_exporter
systemctl enable node_exporter


#验证
systemctl status node_exporter
ss -nulpt|grep node_exporter
3、创建镜像
#使用二.1中的机器名,MACHINE_IMAGE_NAME随便起一个
#命名规则'(?:[a-z](?:[-a-z0-9]{0,61}[a-z0-9])?)'
gcloud compute machine-images create cbw-exporter
    --source-instance=cbw-test
    --source-instance-zone=asia-southeast1-b

#创建成功会出现
Created [https://www.googleapis.com/compute/v1/projects/projectid/global/machineImages/cbw-exporter].
NAME          STATUS
cbw-exporter  READY
4、使用镜像创建新的机器
#修改为自己需要的: 机器名 区域 上一步自己创建的镜像名
gcloud compute instances create cbw-test2
    --zone=asia-southeast1-b
    --source-machine-image=cbw-exporter

#验证
Created [https://www.googleapis.com/compute/v1/projects/projectid/zones/asia-southeast1-b/instances/cbw-test2].
NAME       ZONE               MACHINE_TYPE  PREEMPTIBLE  INTERNAL_IP  EXTERNAL_IP     STATUS
cbw-test2  asia-southeast1-b  e2-medium                  10.148.0.14  35.198.207.140  RUNNING
三、对已存在的机器批量部署node_exporter
- 目的:对已存在的机器部署node_exporter
1、ansible
#安装pip 本环境 python2.7,如果有pip可忽略以下两步
 wget https://bootstrap.pypa.io/pip/2.7/get-pip.py
 python get-pip.py
#安装ansible
 pip install ansible
#创建免密
ssh-keygen
ssh-copy-id user@target_host
#主机 列表
vim inventory.ini
[your_target_hosts]
host1
host2
host3
#批量部署
ansible -i inventory.ini your_target_hosts -b -m shell -a "wget https://github.com/prometheus/node_exporter/releases/download/v1.6.0/node_exporter-1.6.0.linux-amd64.tar.gz"
ansible -i inventory.ini your_target_hosts -b -m shell -a "tar -xf node_exporter-1.6.0.linux-amd64.tar.gz"
ansible -i inventory.ini your_target_hosts -b -m shell -a "mv node_exporter-1.6.0.linux-amd64 /opt/node_exporter"
ansible -i inventory.ini your_target_hosts -b -m shell -a "cat << EOF > /etc/systemd/system/node_exporter.service
[Unit]
Description=node_exporter
[Service]
Type=simple
ExecStart=/opt/node_exporter/node_exporter --web.listen-address=0.0.0.0:9000
ExecReload=/bin/kill -HUP
Restart=on-failure
[Install]
WantedBy=multi-user.target
EOF"
ansible -i inventory.ini your_target_hosts -b -m shell -a "systemctl daemon-reload"
ansible -i inventory.ini your_target_hosts -b -m shell -a "systemctl start node_exporter"
ansible -i inventory.ini your_target_hosts -b -m shell -a "systemctl enable node_exporter"四、服务发现
1、Prometheus gce_sd_config
- GCE SD configurations allow retrieving scrape targets from GCP GCE instances. The private IP address is used by default, but may be changed to the public IP address with relabeling.
2、配置job
#配置示例
global:
  scrape_interval: 15s
  evaluation_interval: 15s
alerting:
  alertmanagers:
    - static_configs:
rule_files:
scrape_configs:
  - job_name: "prometheus"  #本机监控job(可选)
    static_configs:
      - targets: ["localhost:9090"]
  - job_name: "gce_instances"   #gce机器的服务发现(必要)
    gce_sd_configs:
    - project: "your-project-id"
      zone: "asia-southeast1-b"  #可写多个 ["az1","az2"]
      port: 9000        #node_exporter端口
    relabel_configs:   #根据源标签修改自己想要的标签 https://prometheus.io/docs/prometheus/latest/configuration/configuration/#gce_sd_config
     - action: replace
       source_labels:
       - __meta_gce_instance_id
       target_label: instance_id
~
3、权限
#修改红色位置为自己的
gcloud projects add-iam-policy-binding PROJECT_ID
    --member="serviceAccount:SA_NAME@PROJECT_ID.iam.gserviceaccount.com"
    --role="roles/compute.viewer"
下载 service account的key到Prometheus的server中
#如果没有该目录手动创建
mv serviceaccount.json $HOME/.config/gcloud/application_default_credentials.json
#设置环境变量
export GOOGLE_APPLICATION_CREDENTIALS=$HOME/.config/gcloud/application_default_credentials.json
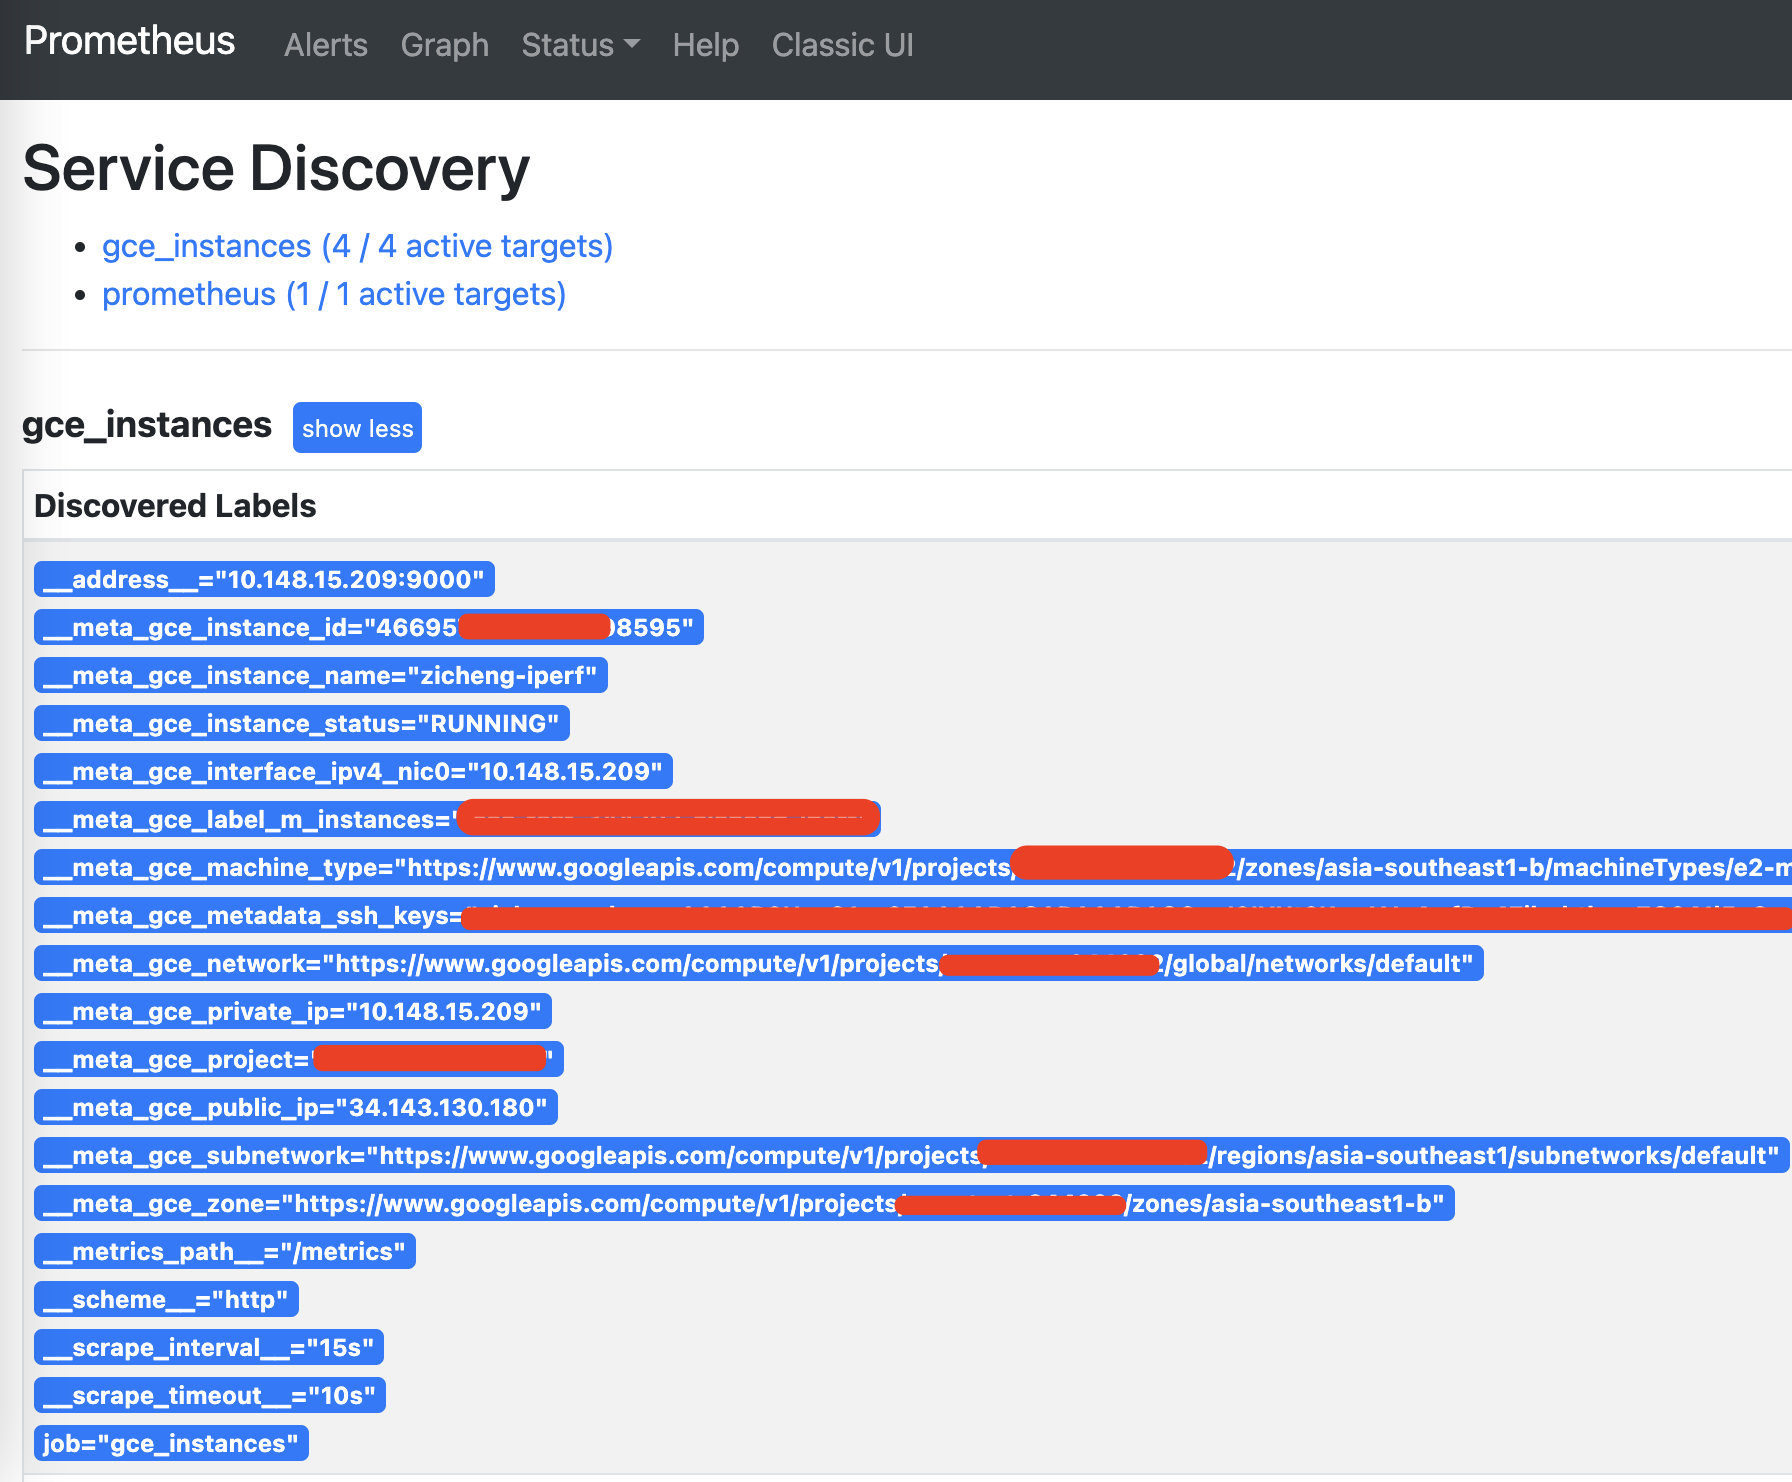
#重启或者reload Prometheus4、服务发现、target、验证
- 服务发现:可以发现该az的所有机器都会被列出来,无需手动一台一台加入prometheus配置文件
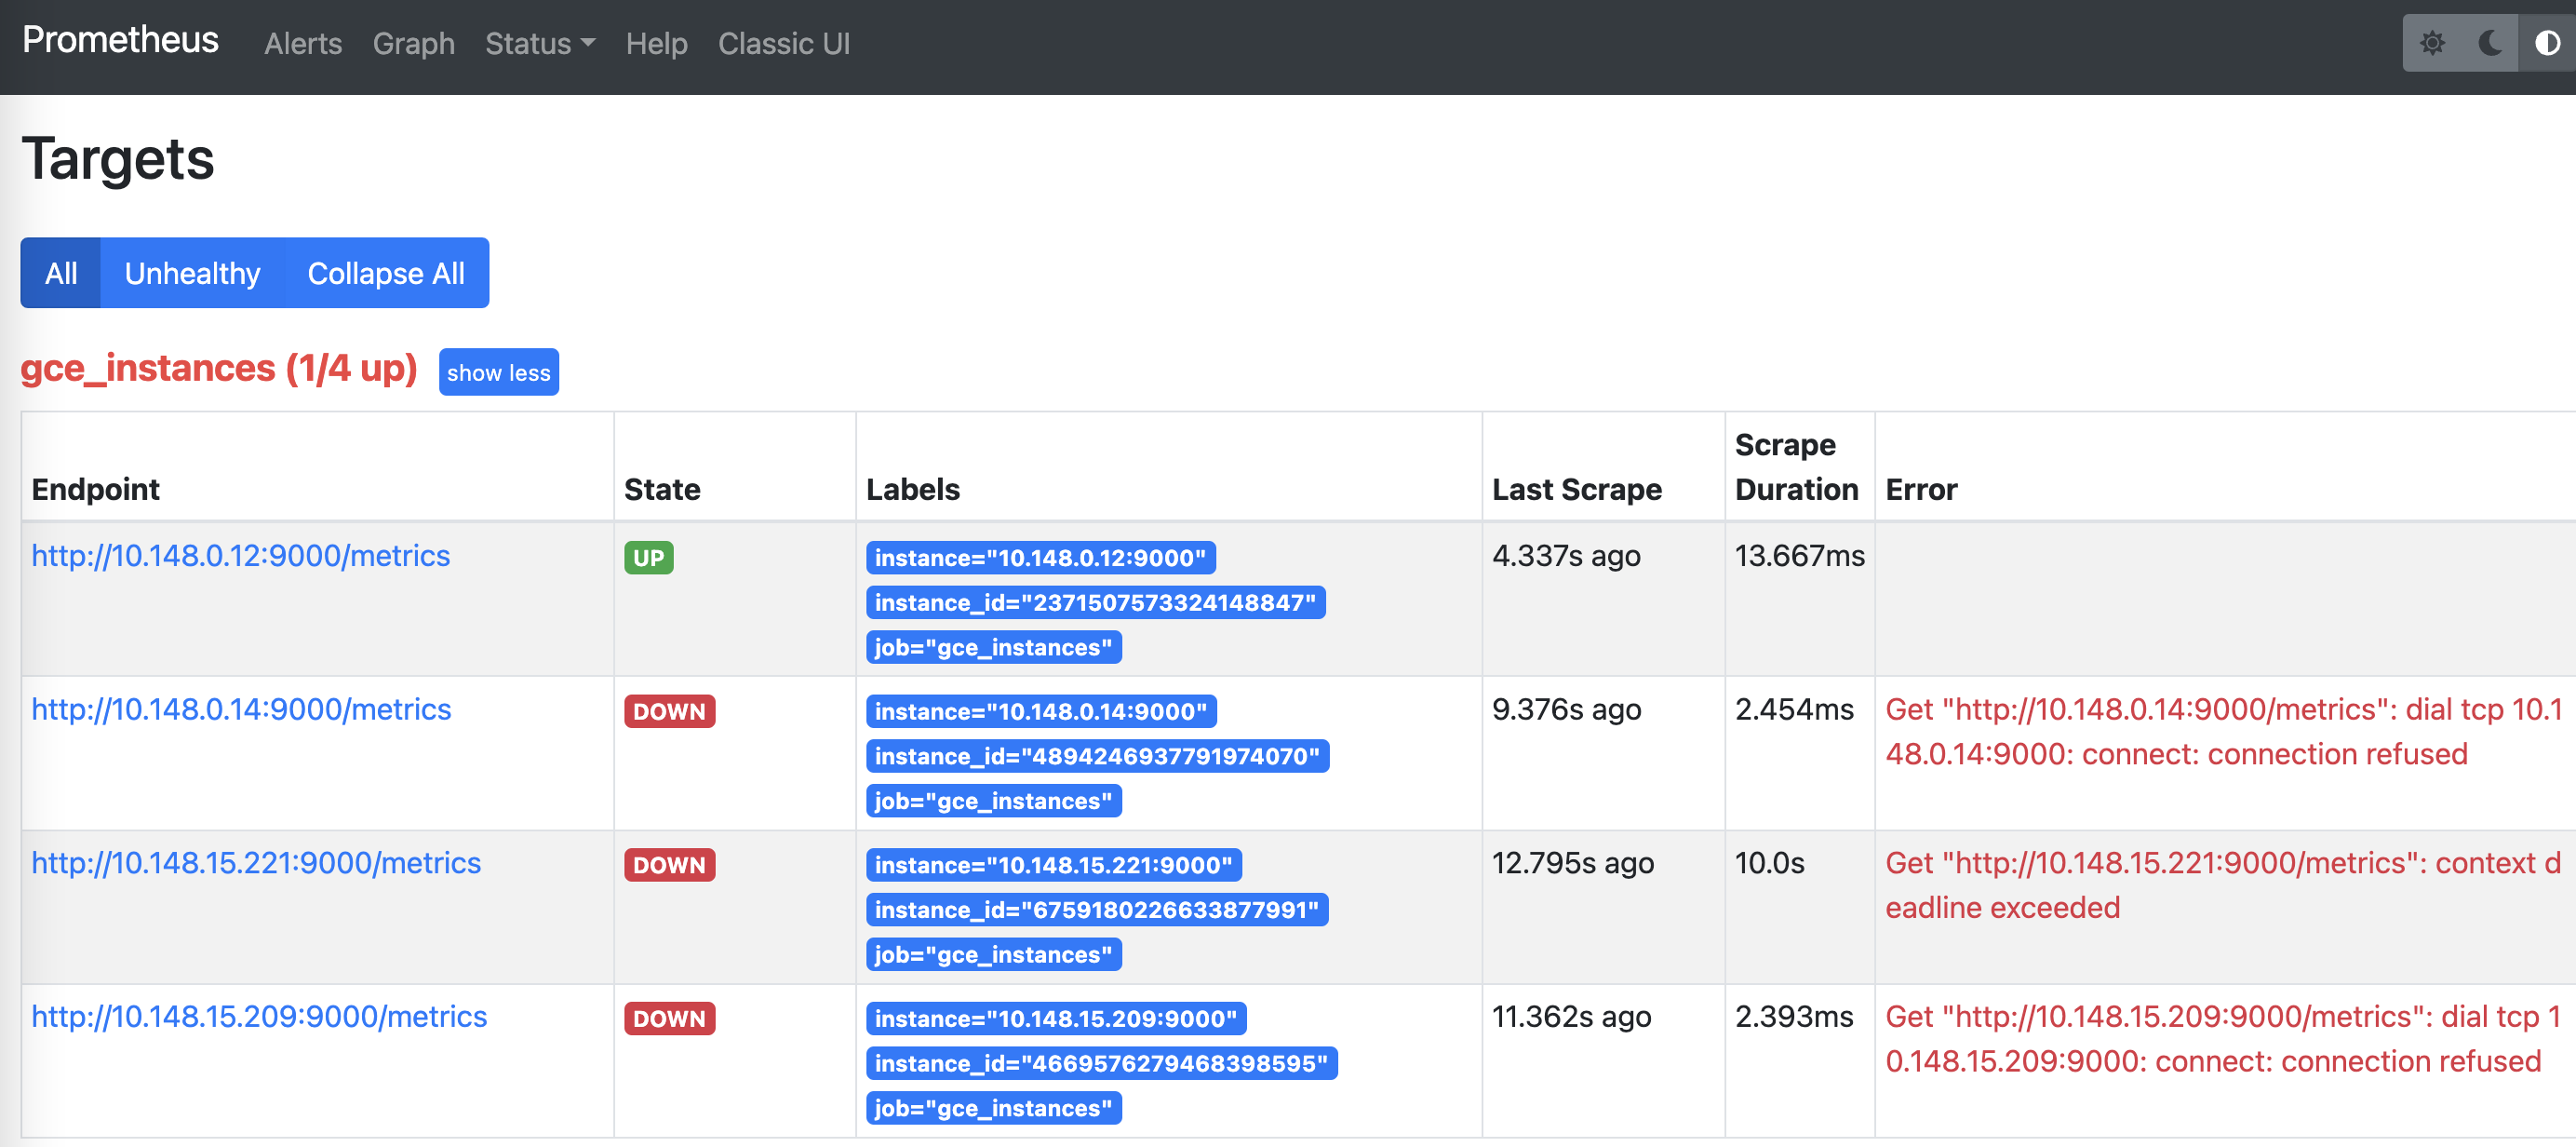
- Target:配合node_exporter即可获取所有gce机器的指标(报错忽略是因为另外该区域的其它实例没有9000端口的访问权限)
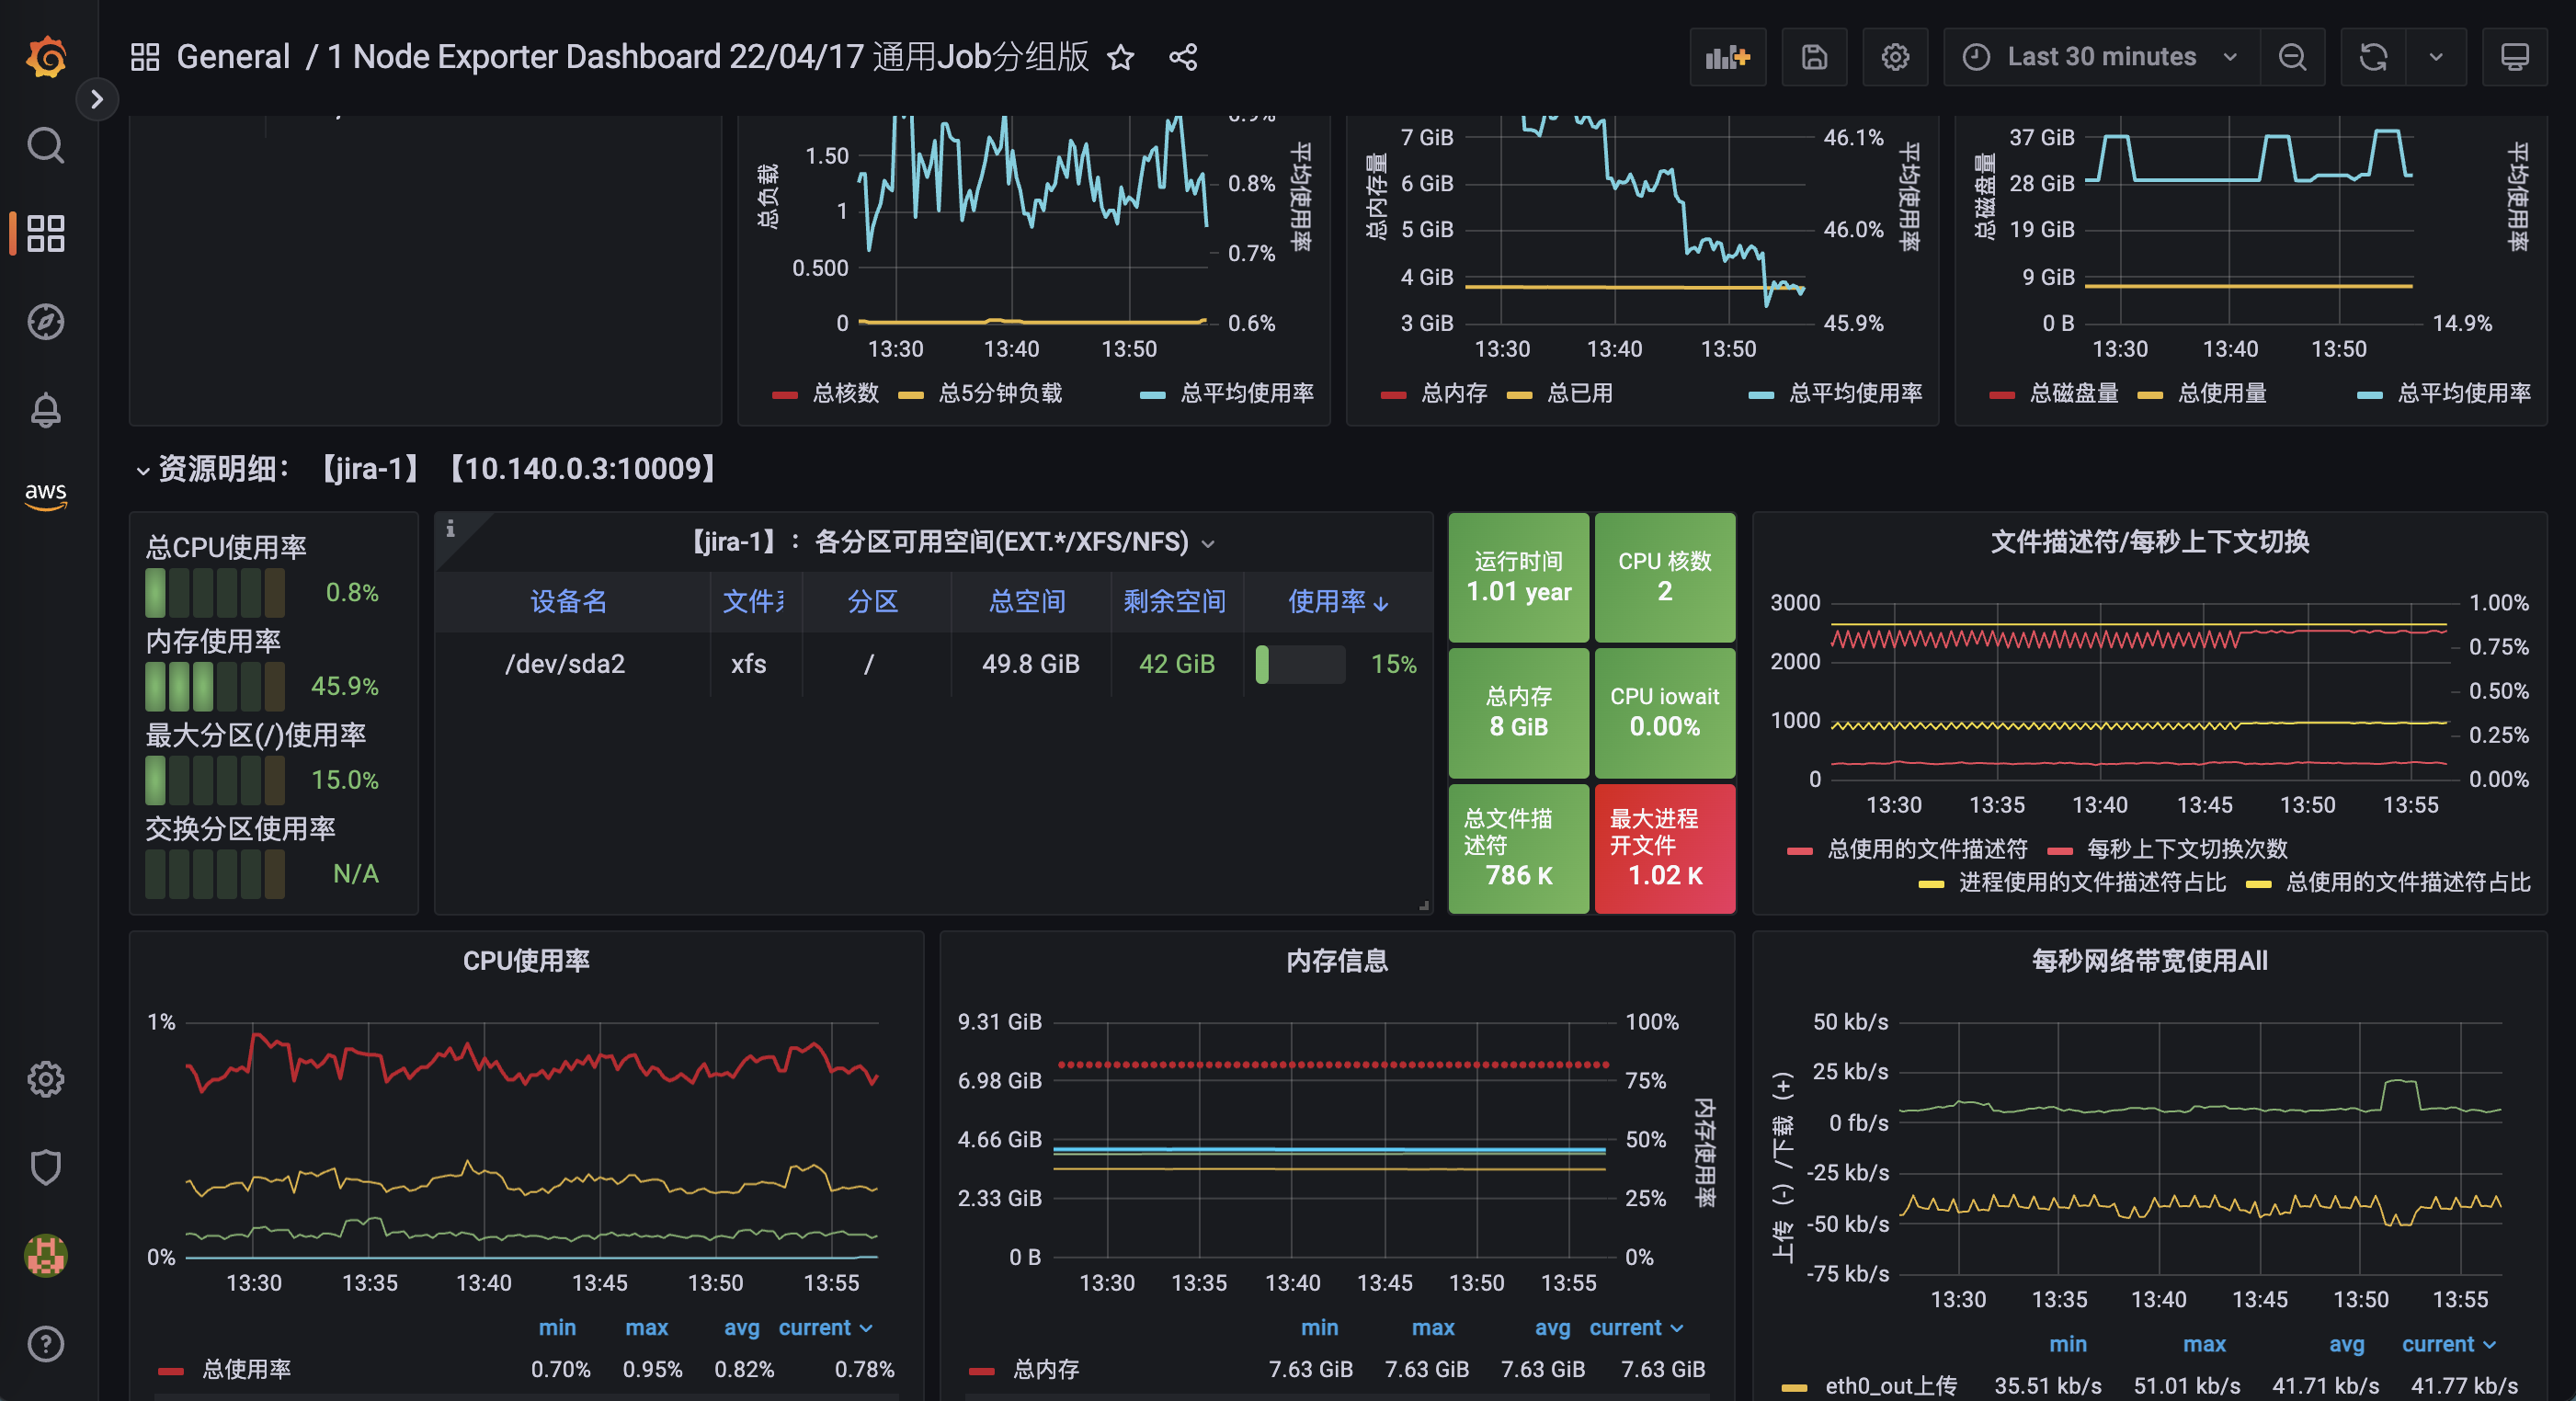
5、接入grafana
推荐仪表盘id:1860